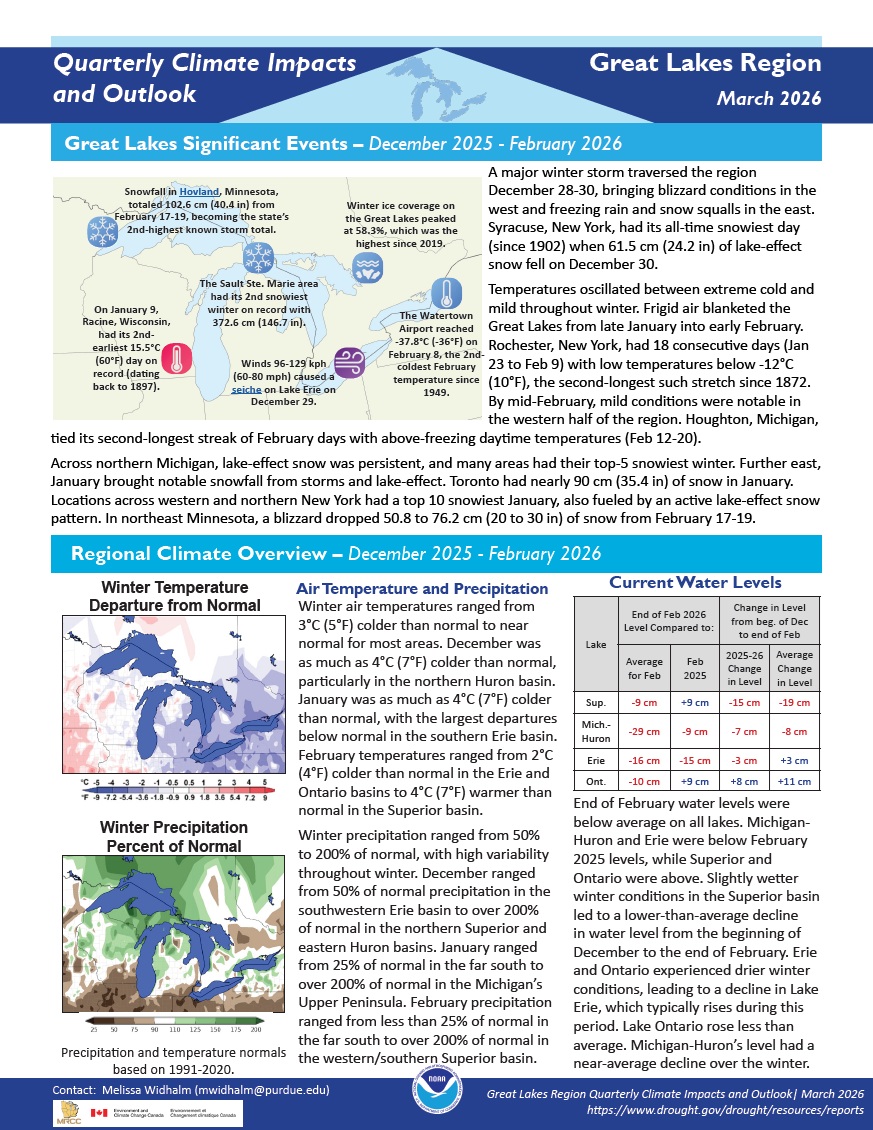
Quarterly Climate Impacts and Outlook for the Great Lakes Region for December 2025–February 2026. Dated March 2026.
Winter air temperatures ranged from 3 °C (5 °F) colder than normal to near normal for most areas. Winter precipitation ranged from 50% to 200% of normal, with high variability throughout winter.
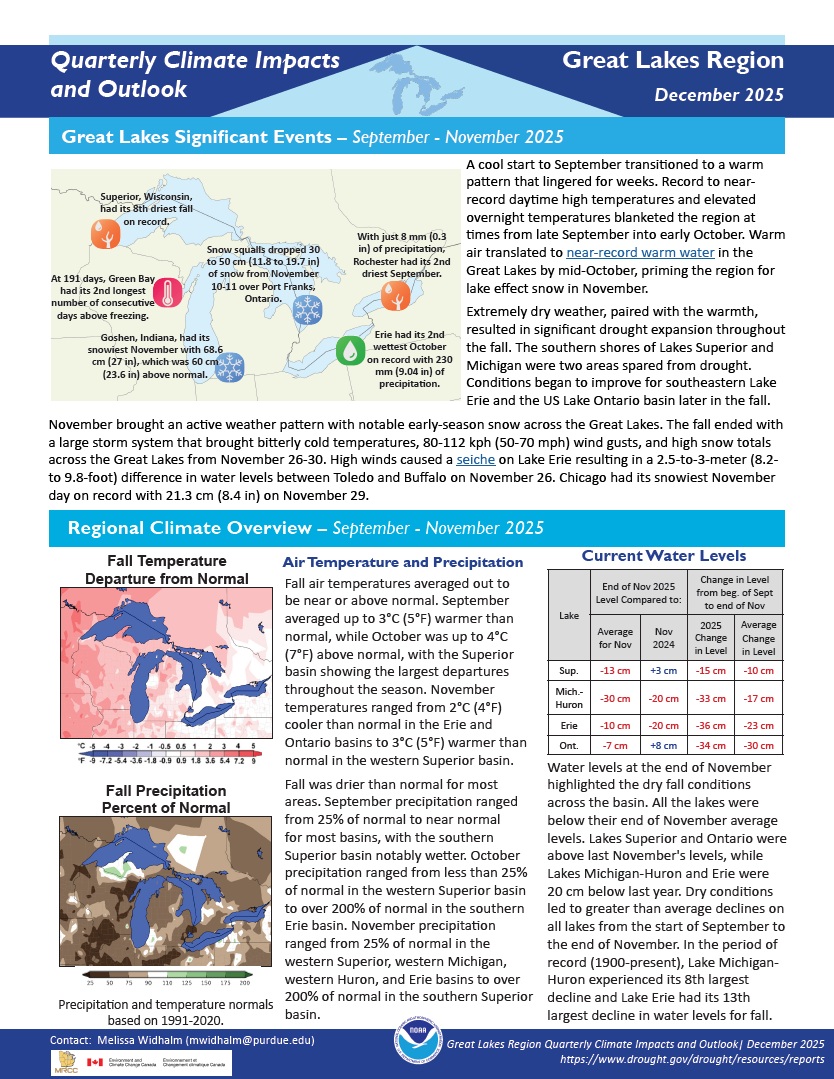
Quarterly Climate Impacts and Outlook for the Great Lakes Region for September–November 2025. Dated December 2025.
Fall air temperatures averaged out to be near or above normal. Fall was drier than normal for most areas. Dry conditions led to greater than average declines on all lakes from the start of September to the end of November. In the period of record (1900-present), Lake Michigan-Huron experienced its 8th largest decline and Lake Erie had its 13th largest decline in water levels for fall.
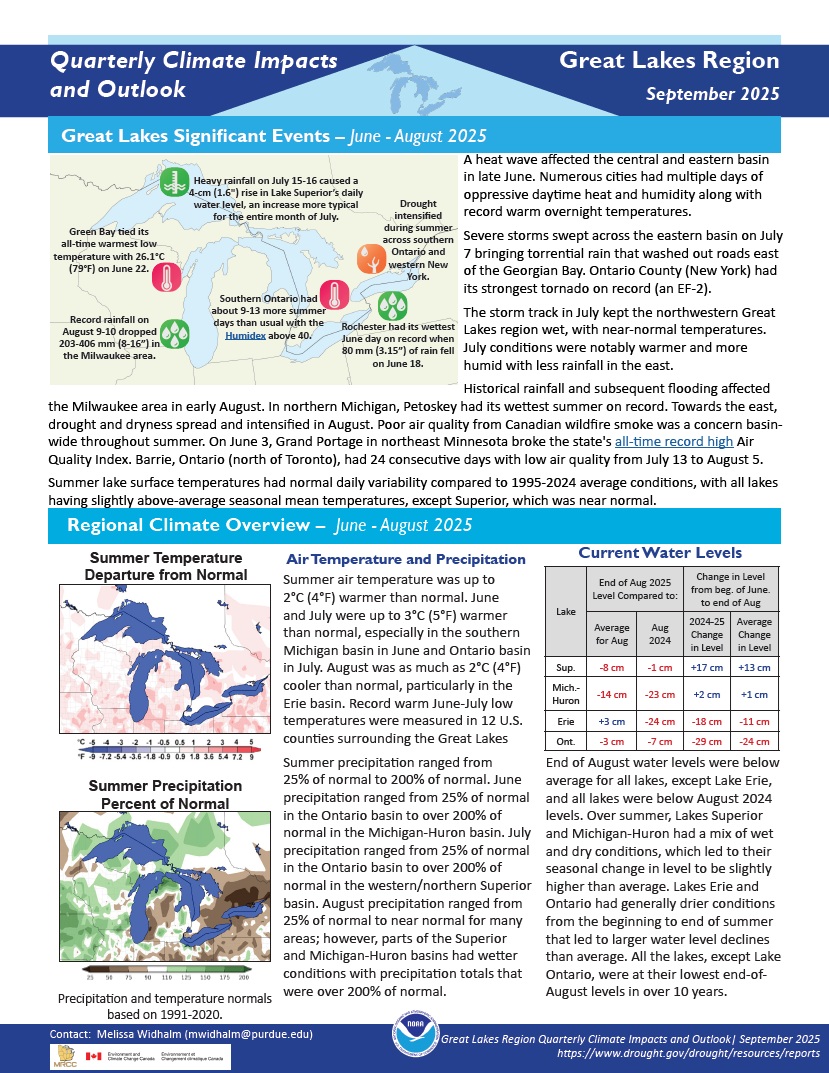
Quarterly Climate Impacts and Outlook for the Great Lakes Region for June–August 2025. Dated September 2025.
Summer air temperature was up to 2°C (4°F) warmer than normal. Record warm June-July low temperatures were measured in 12 U.S. counties surrounding the Great Lakes. Summer precipitation ranged from 25% of normal to 200% of normal.
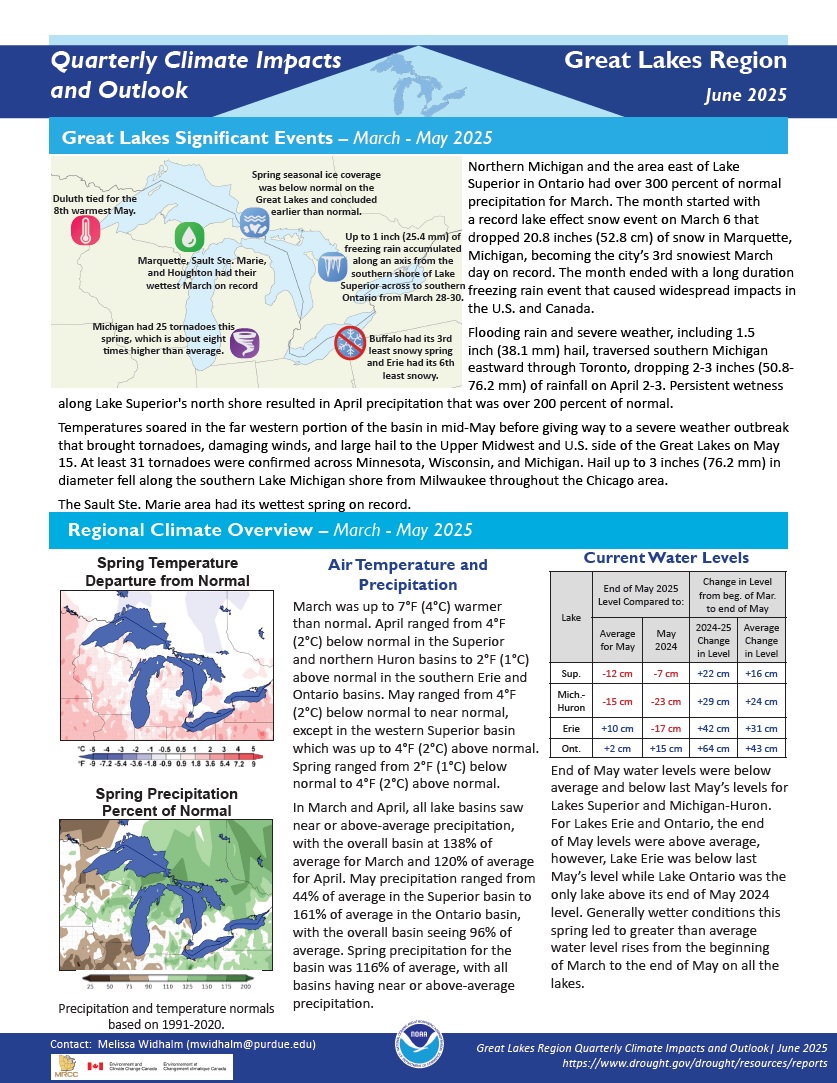
Quarterly Climate Impacts and Outlook for the Great Lakes Region for March–May 2025. Dated June 2025.
Spring temperatures ranged from 2°F (1°C) below normal to 4°F (2°C) above normal. Spring precipitation for the basin was 116% of average, with all basins having near or above-average precipitation.
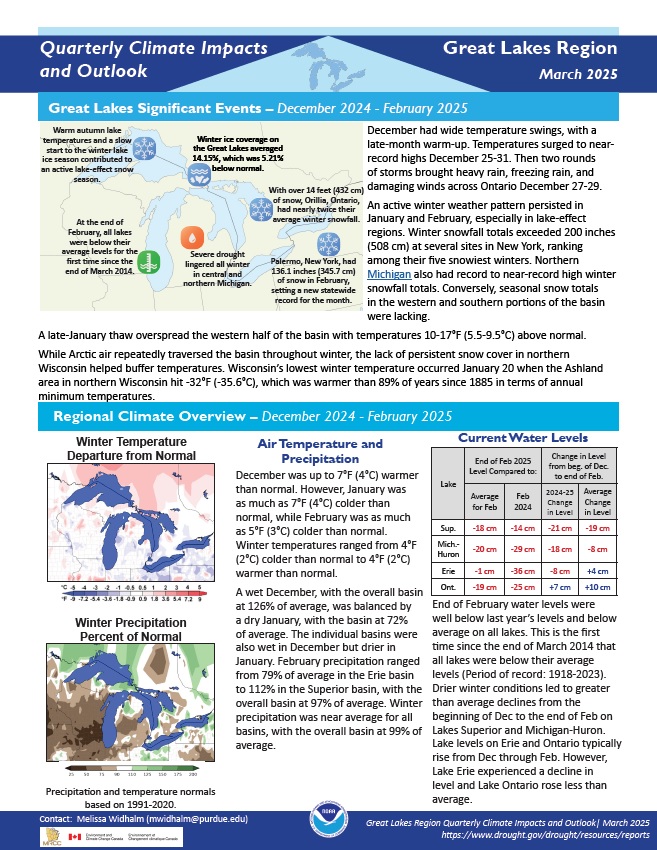
Quarterly Climate Impacts and Outlook for the Great Lakes Region for December 2024–February 2025. Dated March 2025.
Winter temperatures ranged from 4°F (2°C) colder than normal to 4°F (2°C) warmer than normal. Winter precipitation was near average for all basins, with the overall basin at 99% of average.
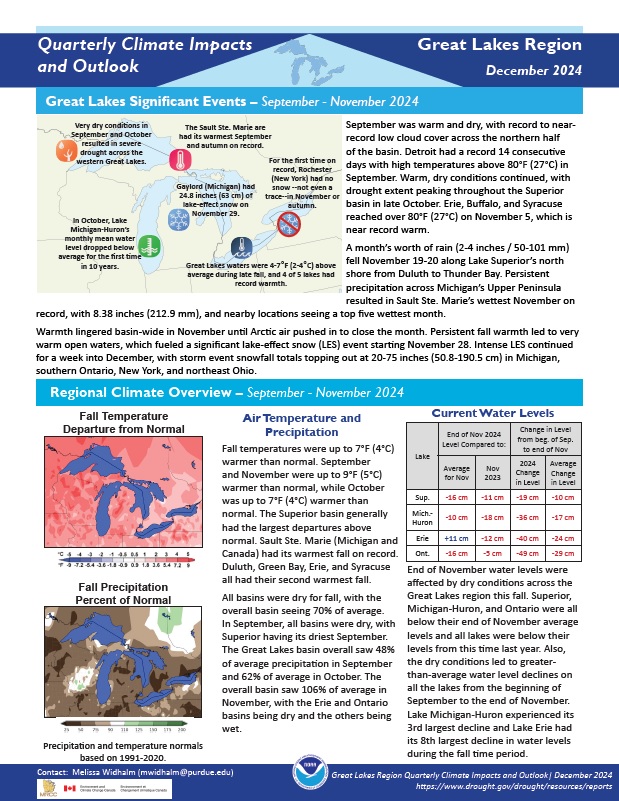
Quarterly Climate Impacts and Outlook for the Great Lakes Region for September–November 2024. Dated December 2024.
Fall temperatures were up to 7 °F (4 °C) warmer than normal. All basins were dry for fall, with the overall basin seeing 70% of average precipitation.
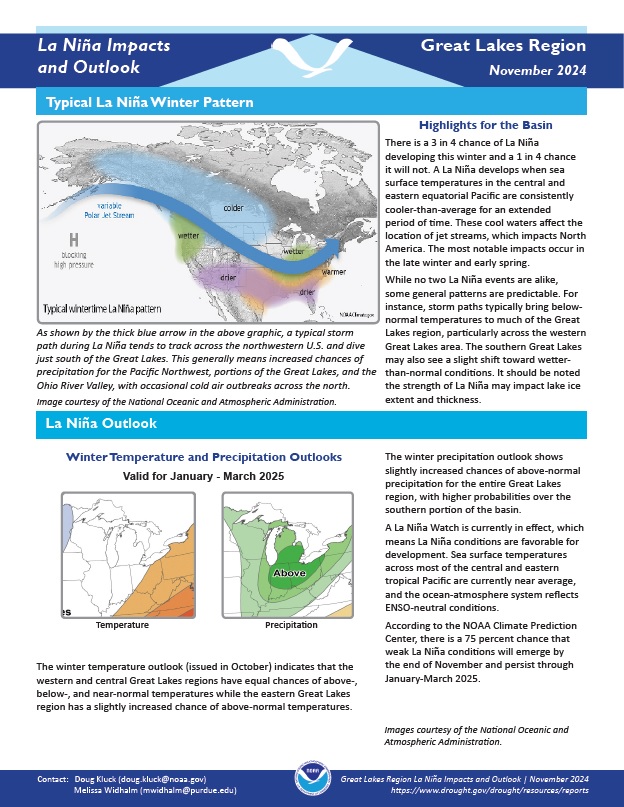
This handout provides information on the typical La Niña winter pattern; the La Niña outlook; potential winter and spring impacts; and comparisons of conditions during previous La Niña years for the Great Lakes region. Updated November 2024.
NOAA’s Regional Climate Services Program created these Outlooks to inform the public about climate impacts within their respective regions. Each regional report contains easy-to-understand language, and anyone can access them through the U.S. Drought Portal.
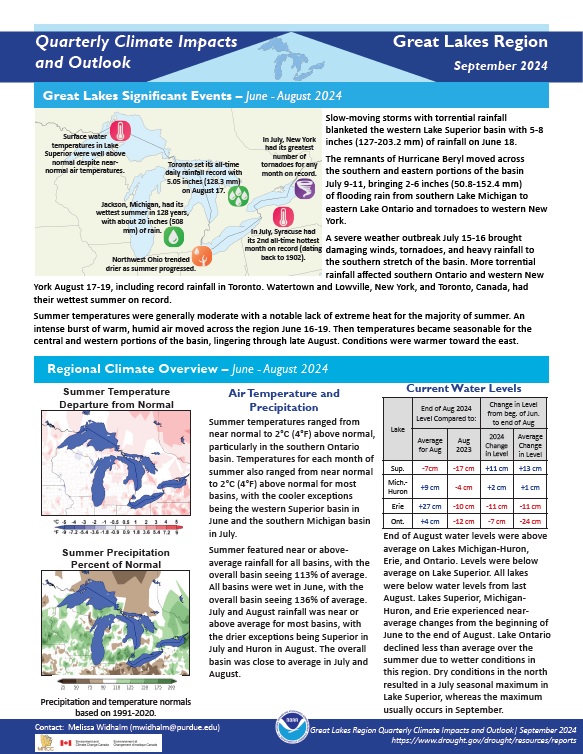
Quarterly Climate Impacts and Outlook for the Great Lakes Region for June–August 2024. Dated September 2024.
Summer temperatures ranged from near normal to 2°C (4°F) above normal, particularly in the southern Ontario basin. Summer featured near- or above-average rainfall for all basins, with the overall basin seeing 113% of average.
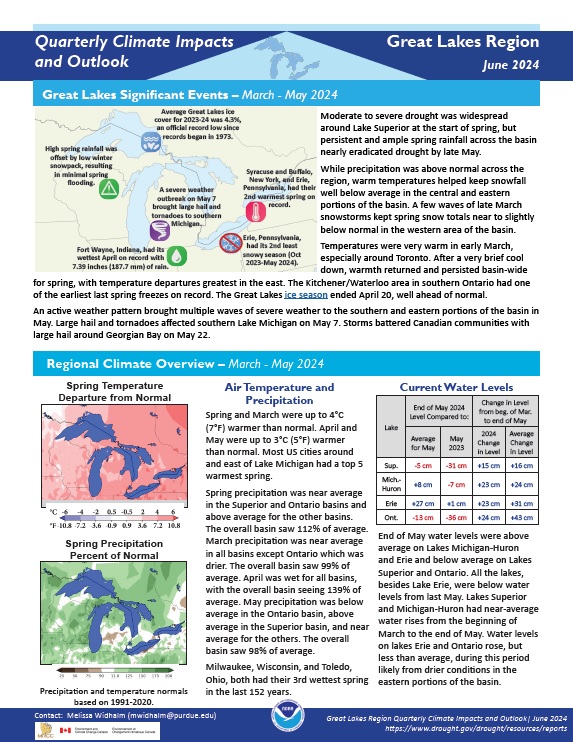
Quarterly Climate Impacts and Outlook for the Great Lakes Region for March–May 2024. Dated June 2024.
Spring and March were up to 4°C (7°F) warmer than normal. April and May were up to 3°C (5°F) warmer than normal. Most U.S. cities around and east of Lake Michigan had a top 5 warmest spring. Spring precipitation was near average in the Superior and Ontario basins and above average for the other basins. The overall basin saw 112% of average precipitation.
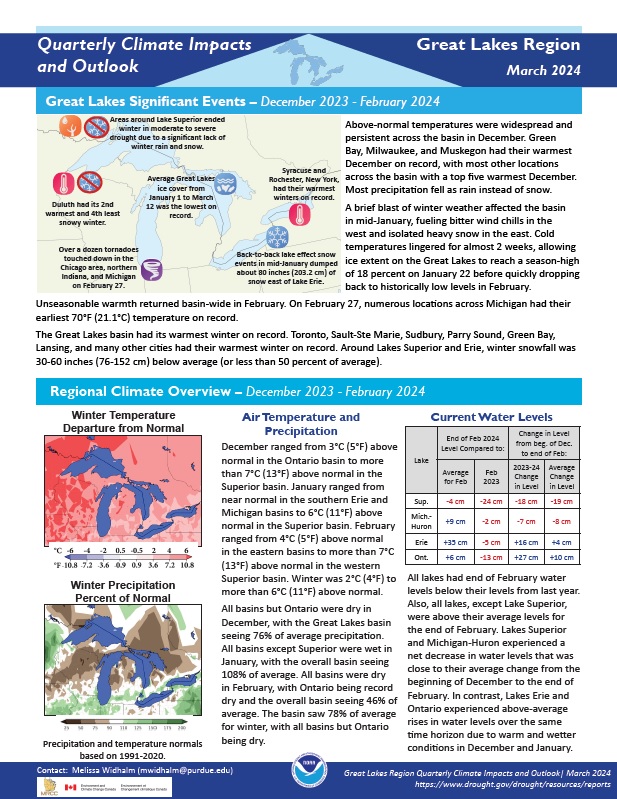
Quarterly Climate Impacts and Outlook for the Great Lakes Region for December 2023–February 2024. Dated March 2024.
Winter was 2°C (4°F) to more than 6°C (11°F) above normal. The basin saw 78% of average precipitation for winter, with all basins but Ontario being dry.